Business

Tourism
Fisheries
Agriculture
 Tourism
- Tourism short-term indicators in April 18/04/2024Employment in the tourism industry in Iceland was 28.451 in February 2024, an increase of 3% compared with February 2023. In the 12-month period from March 2023 to February 2024, an average of 31,584 individuals worked in the tourism industry compared with 28,920 in the previous 12-month period.
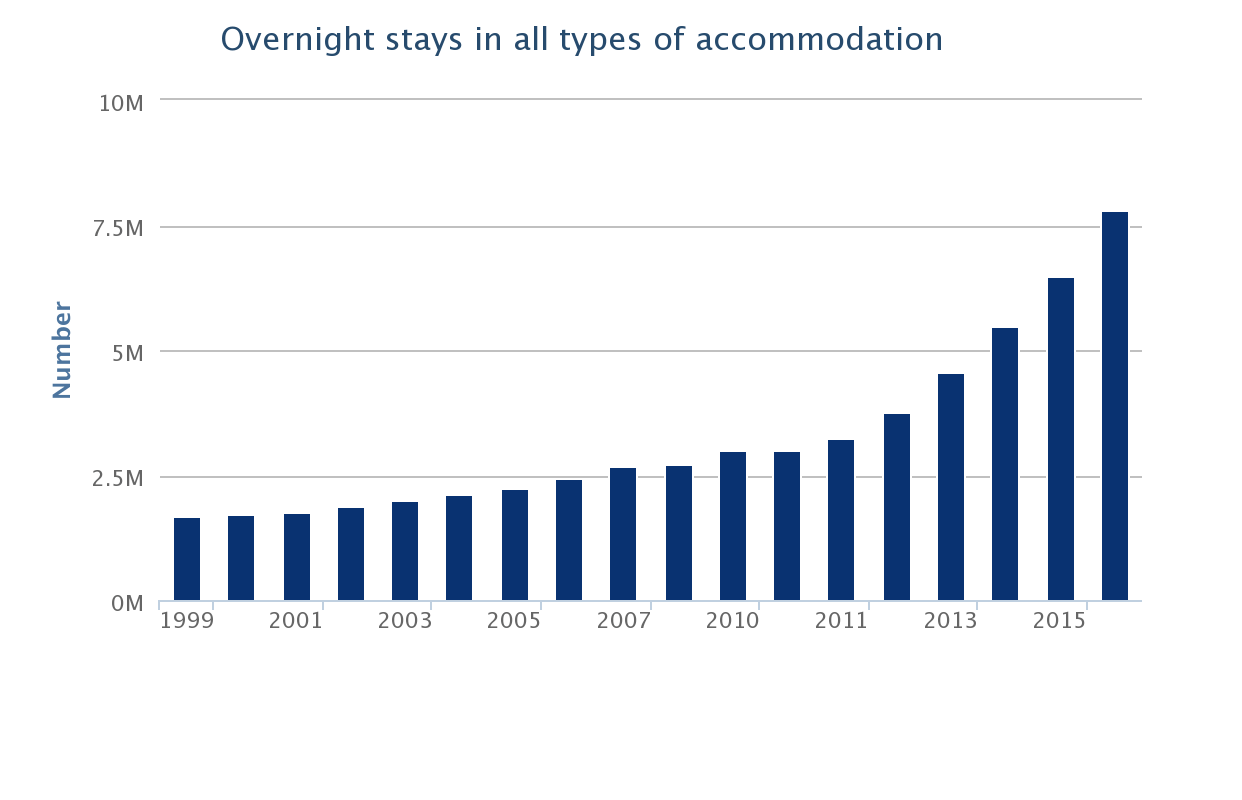
- 2.5% decrease in overnight stays in February 27/03/2024In February 2024, there were 561,000 registered overnight stays in Iceland, which is a 2.5% decrease from February 2023 (575,000). Overnight stays at hotels were 372,700, which is a slight increase from February last year.
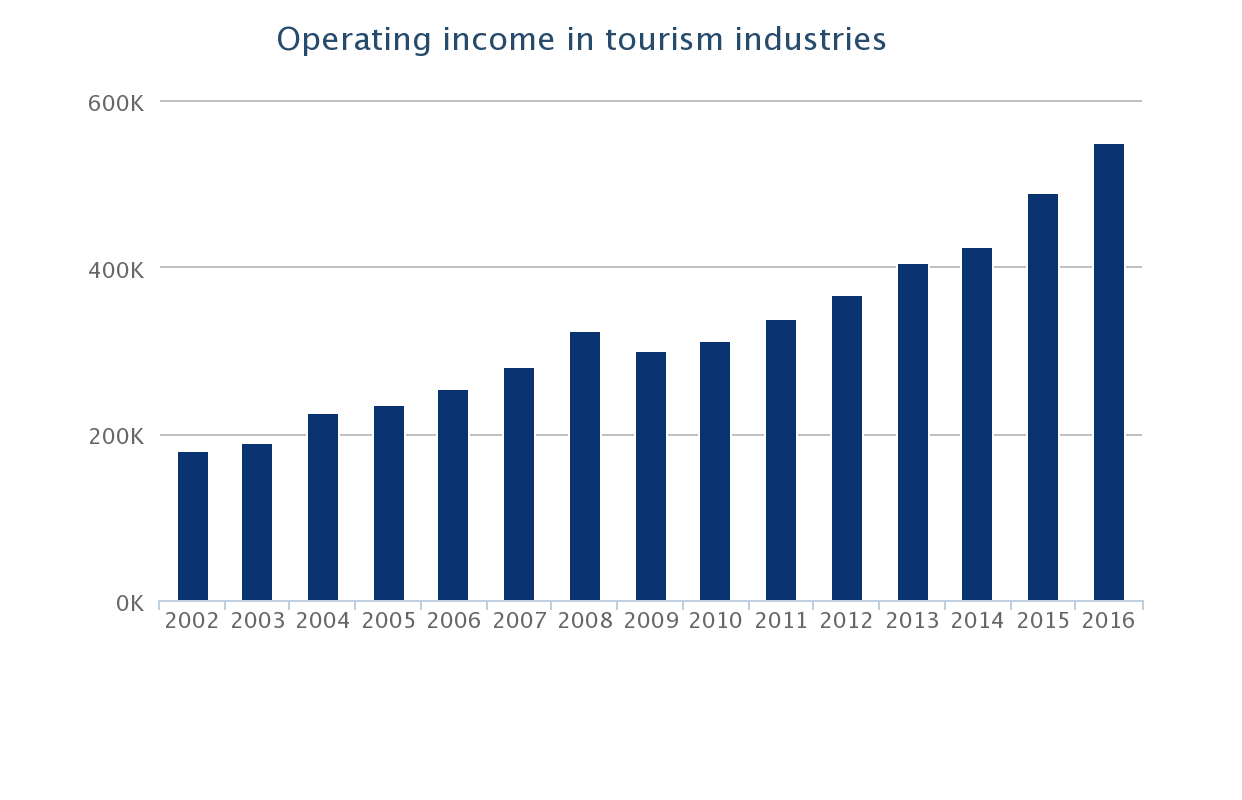
- Tourism short-term indicators in March 21/03/2024Revenue from foreign tourists during the fourth quarter of 2023 was 110 billion ISK compared with the same period last year when it was 98 billion ISK. Revenue from foreign tourists has increased by 31% between the years 2022 and 2023, from 454,5 billion ISK to 597,7 billion ISK.
- 13% decrease in overnight stays in January from last year 29/02/2024In January 2024, there were 390,000 registered overnight stays in Iceland, which is a 13% decrease from January 2023 (450,000). Overnight stays in hotels were 282,600, which is a 10% decrease from January 2023.
- Tourism short-term indicators in February 15/02/2024Employment in the tourism industries in Iceland was 29,960 in December 2023, an increase of 4% compared with December 2022. In the year 2023, an average of 32,113 individuals worked in the tourism industry compared with 28,707 in the previous year.
 Fisheries
- Catch in March was 60 thousand tonnes 15/04/2024The catch of Icelandic vessels was 60 thousand tonnes in March 2024 which is 77% less than in March 2023. There was a decrease in landing of nearly all species. The largest change was the lack of capelin catch in 2024.
- Value of catch in January was roughly 11 billion ISK 03/04/2024The first sale value of catch in January 2024 was roughly 11 billion ISK but was over 17 billion ISK in January 2023. In the twelve month period from February 2023 to January 2024, the total value of catch was about 212 billion ISK which is 1% less than the value of catch in the […]
- The number of fishing vessels continues to decrease 20/03/2024The number of Icelandic fishing vessels was 1,535 at the end of 2023. Of these were 39 trawlers, 678 decked vessels and 818 undecked vessels. The number of fishing vessels has been steadily decreasing in the last decades for all vessel sizes except those over 1,500 gross tonnage, which have increased somewhat. Registered trawlers were […]
- Catch in February was 65 thousand tonnes 15/03/2024The catch of Icelandic vessels was 65.4 thousand tonnes in February 2024 which is 56% less than in February 2023. The pelagic catch was 25 thousand tonnes, 78% less than in February last year. Tthe main explanation for this large difference between years is due to no capelin being landed.
- The value of Icelandic fish catch in 2023 was 197 billion ISK 29/02/2024The total catch of Icelandic vessels in 2023 was 1,375 thousand tonn which was valued as 197 billion ISK at first sale. In tonnes the catch decreased by 3% while the first sale value increased by 1% compared with 2022.
 External trade
- Trade deficit of 32.5 billion ISK in March 26/04/2024The value of exported goods amounted to 64.3 billion ISK fob in March 2024 (64.2 billion ISK according to preliminary figures) and the value of imported goods was 96.8 billion ISK cif (97.5 billion) after revision of preliminary figures. The trade deficit in March was therefore 32.5 billion ISK (33.3 billion ISK).
- Trade deficit of 33.3 billion ISK in March 08/04/2024The value of exported goods from Iceland amounted to 64.2 billion ISK fob in March 2024 and the value of imported goods 97.5 billion ISK cif (92.2 billion ISK fob) according to preliminary figures. Thus, there was a trade deficit, calculated on fob/cif value, of 33.3 billion ISK as compared with a trade deficit of […]
- Trade deficit of 20.5 billion ISK in February 22/03/2024The value of exported goods amounted to 79.7 billion ISK fob in February 2024 (79.7 billion ISK according to preliminary figures) and the value of imported goods was 100.2 billion ISK cif (100.4 billion) after revision of preliminary figures. The trade deficit in February was therefore 20.5 billion ISK (20.7 billion ISK).
- Trade deficit of 20.7 billion ISK in February 07/03/2024The value of exported goods from Iceland amounted to 79.7 billion ISK fob in February 2024 and the value of imported goods 100.4 billion ISK cif (95.2 billion ISK fob) according to preliminary figures. Thus, there was a trade deficit, calculated on fob/cif value, of 20.7 billion ISK as compared with a trade deficit of […]
- Trade deficit of 20 billion ISK in January 29/02/2024The value of exported goods amounted to 79.2 billion ISK fob in January 2024 (88.2 billion ISK according to preliminary figures) and the value of imported goods was 99.2 billion ISK cif (99.0 billion) after revision of preliminary figures. The trade deficit in January was therefore 20.0 billion ISK (10.8 billion ISK). The deviation from […]
